




 Quarter-End Demand Sends Dry Van Spot Rates Higher
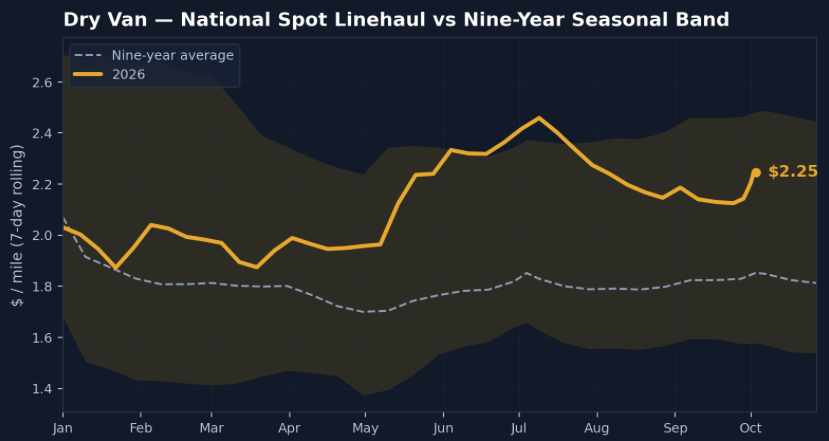
Dry van spot rates jumped last week as a surge in quarter-end freight activity collided with tightening truck availability.
The national average linehaul rate climbed 5.5%, or $0.12 per mile, to $2.25, excluding fuel. Rates now sit 33.5% ($0.56) above last year’s levels and 21.6% ($0.40) above the nine-year seasonal average of $1.85.
Freight demand outpaces capacity
The final push to close out the third quarter brought a significant increase in freight activity. Dry van load postings surged 17.5% week over week, while available truck postings declined 2.4%.
That imbalance pushed the load-to-truck ratio to 13.72, up from 11.40 the previous week and nearly double the 7.67 recorded a year ago. The combination of stronger demand and fewer available trucks gave carriers additional pricing leverage heading into October.
The Great Lakes led major outbound markets with a $0.10 per mile increase, bringing average rates to $2.59. California followed with a $0.07 gain to $2.45, while the Ohio River region also added $0.07 to reach $2.54.
Meanwhile, DAT’s 10 benchmark dry van states averaged $2.99 per mile, an $0.08 weekly increase and $0.83 above year-ago levels. These markets accounted for 35.6% of national outbound dry van volume.
Despite the quarter-end surge, DAT expects dry van pricing to stabilize in the coming weeks. Its 35-day forecast projects an average linehaul rate near $2.24 per mile, with a likely range of $2.17 to $2.31.
While the seasonal demand spike may fade, reduced truck availability and substantial year-over-year rate gains suggest the market will remain considerably tighter than it was last fall.
 Reefer Spot Rates Climb as Produce Markets Shift
Refrigerated spot rates moved higher last week as quarter-end shipping activity tightened available capacity, even as produce volumes softened across several major growing regions.
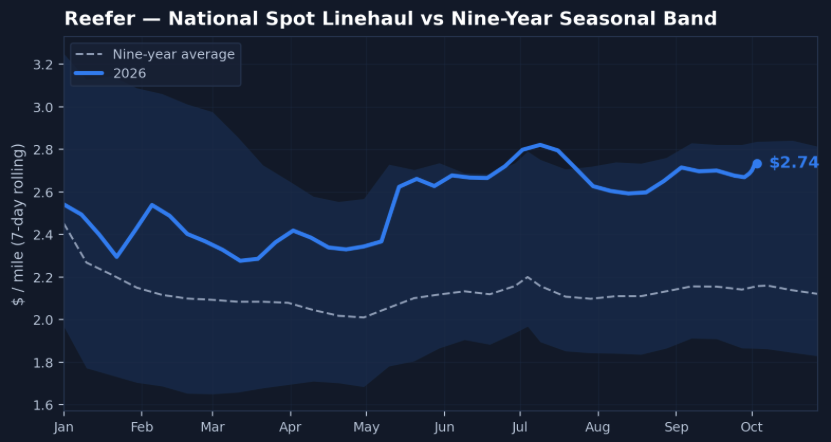
The national average reefer linehaul rate increased 2.5%, or $0.07 per mile, to $2.74, excluding fuel. Rates are now 32.7% ($0.68) above year-ago levels and 28% ($0.60) above the nine-year seasonal average of $2.14.
Reefer load postings climbed 11.8% week over week, while available truck postings declined 5.7%. The resulting imbalance pushed the load-to-truck ratio to 21.65, up from 18.26 the previous week and 13.48 a year earlier.
Much of the increase reflected a late-quarter shipping push, with freight spilling into the spot market as contracted capacity filled up.
Regional pricing remained elevated, particularly in the Upper Midwest and Great Lakes, where outbound rates averaged $3.43 and $3.34 per mile, respectively. The Upper Atlantic recorded the strongest weekly increase at 3.3%, while the Pacific Northwest experienced the largest decline at 3.2%.
Produce markets presented a mixed picture, with nationwide refrigerated produce volumes declining 2% week over week and 3% year over year.
Washington remained a standout for refrigerated carriers. Apple and pear shipping rates averaged 72% above last year’s levels, despite holding steady for the week. Freight volumes were unchanged from the previous week and 5% higher year over year, keeping the state’s tree fruit market relatively stable.
California experienced a more noticeable slowdown, with overall produce shipments falling 6% for the week. Strawberry volumes declined 18%, cantaloupes dropped 13%, and grapes slipped 5%.
Despite the reduced activity, California outbound rates remained approximately 40% above last year’s levels. Shipments heading to New York became particularly expensive, with rates increasing between 9% and 16% across several major growing districts.
DAT’s 35-day forecast projects refrigerated linehaul rates to remain near $2.75 per mile, with an expected range of $2.66 to $2.84.
Although seasonal produce demand is beginning to shift, limited truck availability and continued strength in key agricultural markets should help support elevated pricing through October.
 Tight Capacity Keeps Flatbed Rates Elevated
Flatbed entered October with the tightest spot market of the three major equipment types, as limited truck availability continued to support elevated pricing.
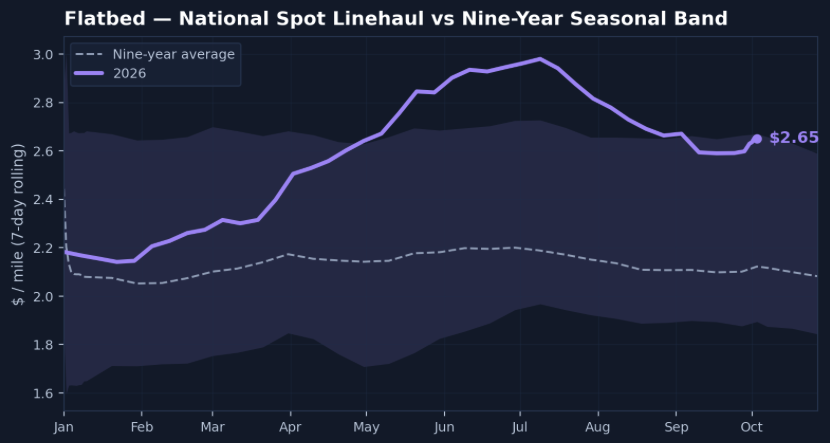
National average flatbed linehaul rates increased 1.6%, or $0.04 per mile, to $2.74, excluding fuel. That’s 34.5% ($0.70) higher than the same week last year and 21.8% ($0.49) above the nine-year seasonal average.
Flatbed load postings increased 5.7% week over week, while available truck postings fell another 4.8%. That combination pushed the national load-to-truck ratio from 31.33 to 34.77, the highest of the three major equipment types.
The ratio is also dramatically higher than the 15.67 recorded during the same week last year, underscoring just how much capacity has tightened compared with 2025.
Construction-related freight continues to offer some support heading into fall. Shipments of lumber, steel, roofing materials, and other building products remain important sources of flatbed demand, even as residential construction faces pressure from affordability and financing costs.
The result is a market where freight demand doesn’t necessarily need to boom to keep rates elevated. With fewer trucks competing for available loads, even relatively modest shipment volumes can maintain upward pressure on pricing.
The Southeast remained the strongest flatbed region last week, averaging $3.09 per mile, followed closely by the South Central region at $3.07.
Among DAT’s 10 benchmark flatbed states, average spot rates increased $0.06 to $3.15 per mile, roughly $0.80 higher than the same period last year. Those states represented nearly 40% of national outbound flatbed volume.
DAT’s 35-day forecast projects flatbed linehaul rates to average around $2.73 per mile, with an expected range between $2.65 and $2.81.
Demand may fluctuate as construction and agricultural freight move deeper into their fall patterns, but the bigger story remains capacity. With fewer trucks on the board and load-to-truck ratios well above last year’s levels, flatbed enters October with carriers maintaining the upper hand.